


Table of Contents
- 1.Product Development Benchmark Tests
- 2.Benchmark Concept Test
- 3.Benchmark Ad Test
- 4.High Resolution Multiple Concept Test
- 5.High Resolution Multiple Ad Test
- 6.High Resolution Multiple Package Test
- 7.High Resolution Multiple Promotion Test
- 13.Customer Experience Benchmarking
- 14.Customer Satisfaction / Dissatisfaction Test - Brand Health
- 15.Key Competitor Customer Satisfaction / Dissatisfaction Test
- 16.Market Review - All Competitor Reviews and Benchmarking by All Users
- 17.Corporate or Brand Imagery and Reputation
- 18.Brand Awareness, Attitude and Satisfaction Tracking Study
- 19.Website Visitor Satisfaction and Tracking
- 20.Transactional Satisfaction, In-Market Product Test
- 21.Website and Kiosk Research and Development
- 22.Website Visitor Satisfaction and Tracking
- 23.Website and Kiosk User Experience Development Lab
- 24.Specialty Research Products
- 25.Enhanced Focus Group Screener
- 26.Interactive Focus Group Moderator's Tool
- 27.Linescale General Surveys
Clients can click here for an interactive Wizard with advice on when to use which product. Choose Set up a new test, but take care to stop when you reach "Step One" else the Wizard will create a live interview for you.
Product Development Benchmark Tests
(Click title to open description)
Benchmark Concept Test
This is the ideal concept test. Preference Segmentation with Normative scoring and recommendations on next steps. Methodology is consistent across product or service categories. Concepts are tested in context of their current perception of alternatives in the category, which allows comparing scores across categories. Multivariate Driver Analysis of respondent's reasons for rating analyzed by Acceptors vs. Rejectors and Acceptors vs. Borderline shows what's working and what's hurting. Each individual respondent's report, including verbatims, also displayed and ranked by score for granular qualitative insight
How it works: After benchmarking the linescale with their favorite alternative and their impression of the category in general, the Concept is presented in two separate exposures for thoroughness of evaluation. The first exposure (called Concept) rates the intuitive, immediate reaction to the overall idea, usually expressed briefly in a headline and several copy lines. The second exposure (called Experience) recaps the first exposure, but more fully develops the description, benefits, limitations, features and possibly price of the concept. The second exposure accomplishes two important goals: (1) It provides for a more thoughtfully considered, analytic evaluation and rating of the concept, and (2) It gives the respondent a second chance to rate the idea with more information. All additional question types give maximum flexibility to optimize the concept since, as a single concept test free from interaction influence from other concepts, the respondent focuses fully and clearly on the test concept.
This test typically is used for both concept go/no-go decisions as well as for iterative development and improvement. Use this test if you have a serious concept candidate, or want a normative evaluation.
- One concept is benchmark tested for maximum evaluation precision and full diagnostic feedback.
Rating on uniqueness, believability and relevance plus likelihood of recommendation give additional diagnosis and contribute to scoring.
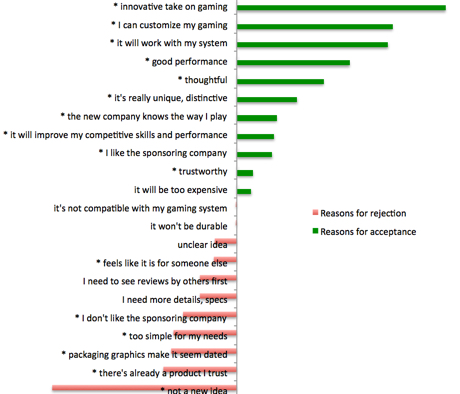
The respondent's score for the concept is calculated by algorithm and described in plain lanuage for the respondent's agreement or disagreement. Then the respondent reports verbatim why they rated as they did. Selection of up to five main reasons for their rating from the list of positives and negatives follows. Example of Multivariate Driver Analysis of positive and negative reasons automatically calculated (below).
- Components, or features of the concept can then be individually tested to learn how much each contributes to the acceptance of the concept by adding Rating Sets of specific features.
- Rating Sets evaluating or testing the importance of alternative selling ideas, features and benefits can be added as well.
- This same test can also measure appeal of alternative names or package variations for the concept, although stand-alone Linescale Name and Package screeners do a more thorough evaluation.
- Add-on questions can be included for price testing via Van Westendorp (useful for establishing maximum price), and for trial-and-repeat and use-occasion estimates.
Benchmark Ad Test
This test is able to show whether a commercial, video or print communication was persuasive, how persuasive, whether it changed attitudes and predispositions to purchase or act, and among what segments of the population. The Ad is tested compared to benchmark competition and current expectations for the brand or product. It can show what brands or products the commercial is appealing to, and who is likely to switch from what brand or product to the advertised product. The test points up what is working in the ad and what is not working. It can provide a profile of what is positive and negative about the ad.
Online Dial Interest Meter - After scoring a Video or Ad Spot, our Online Interest Dial can measure interest or disinterest in each moment of the spot as it flows. Read results by any time unit from 1/2 second or longer.
It is always difficult to differentiate whether performance of an ad is limited by the features of the product advertised or by the character and values of the ad, but Linescale can do as good a job as possible job of differentiating features, attributes and emotional values of the ad versus the product.
While this test is not designed to tell you how likely the ad is to attract attention in a clutter environment, it can tell you about the persuasive and communication value of the ad among those who noticed it.
We recommend the standard uniqueness, believability and relevance or importance to me variables be used for additional rating and then likelihood of recommendation. Persuasiveness can be used as a scoring variable instead of uniqueness or relevance.
The score for the ad is calculated by algorithm and shown for agreement or disagreement, then a verbatim on why they rated as they did follows. After selection of up to five main reasons for their rating from the list of positives and negatives, an additional verbatim is taken on what the respondent thought was the main point of the ad.
This can be followed by several rating sets for features or attributes of the ad or the product advertised. Custom questions can be added for usage frequency, occasions, etc. The optional Dial Interest Meter adds another learning dimension.
The technique is pre-post, but in the unique benchmark competitive context Linescale affords. The competitive alternatives can be brands, products or behavioral practices in the space.
In short, the test assess lift provided by the test communication over current brand impression and competition for full video, roughs, animatics, storyboards, print or brochures. The test measures of communication, attitude shift, persuasion versus competition, motivating reasons for rating and full diagnosis. Can be used post-launch as well as pre-launch.
High Resolution Multiple Concept Test
Multi-Concept Exploratory of two to five ideas. Preference Segmentation (Acceptor) scores PLUS analysis of two to five concepts. Individual Respondent Reports sortable by concept preferred. After benchmarking the linescale with two favorite alternatives the concepts are presented for evaluation in rotated order. The concept is rated after a single exposure, although multiple pages may be used to describe the concept. The Acceptor Score is affected to some degree by two factors; (A) the presence of other concepts causes an interaction effect. Information from, and their evaluations of other concepts will affect ratings of each concept to some degeree, and (B) order effect. Typically there is a first-tested preference over second tested, second often preferred to third, fourth generally preferred to third and fifth generally preferred to fourth. This order effect is sometimes called a "J-Curve" (sort of a short hockey stick.) Randomization spreads the order effect equally across all concepts, but the absolute levels may be affected. All concepts are rated against two controls and against each other on the Overall Appeal scale, but each concept is rated alone on attribute scales and recommendation scales.
Each idea receives, in addition to a Preference Segmentation score, a Driver Analysis identifying what's working, what's not working and relative importance of driving reasons behind acceptance or rejection for each concept. Each individual respondent's verbatim comments on why they rated as they did are reported for high granularity insight. This provides rich development feedback for refining and optimizing. This is a proto-monadic test with some degree of interaction between items, but the richness and depth of feedback make it a good tradeoff if there are too many candidates or it is premature to do Benchmark Concept testing of a single concept. Additional questioning can be done for each concept, but care must be taken since interaction effects may influence results.
High Resolution Multiple Ad Test
If there are several ideas that have been worked through to even a rough state of finish, the Multi-Ad Exploratory of two to five Videos, storyboards or Print Ads would be right. This gives a Benchmarked Preference Segmentation Score for each Communication, plus a Driver Analysis and verbatim diagnosis of strengths and weakness of each Ad, adcept or board. This is High Resolution since each idea receives, in addition to the Preference Segmentation score versus competitive alternatives, a Driver Analysis identifying what's working, what's not working and relative importance of driving reasons behind acceptance or rejection for each tested Ad. Each respondent's verbatim comments on why they rated as they did are reported for high granularity insight. This provides rich development feedback for refining and optimizing. It is a proto-monadic test with some degree of interaction between items, but the richness and depth of feedback make it a good tradeoff if the job is to sort out the best among strong contenders. (See the High-Resolution Multiple Concept Test description above for more details on scoring.)
High Resolution Multiple Package Test
Multi-package Exploratory of two to five packages. Preference Segmentation scores PLUS driver analysis. Each package receives, in addition to a Preference Segmentation score, a Driver Analysis identifying what's working, what's not working and relative importance of driving reasons behind acceptance or rejection for each package. Each respondent's verbatim comments on why they rated as they did are reported for high-granularity insight. This is a screening test which also provides rich development feedback for refining and optimizing. It is a proto-monadic test with some degree of interaction between items, but the richness and depth of feedback make for a good tradeoff to decide between alternatives. (See the High-Resolution Multiple Concept Test description above for more details on scoring.)
High Resolution Multiple Promotion Test
Multi-promotion Exploratory of two to five promotions. Preference Segmentation scores PLUS analysis of two to five promotions. Each promotional idea receives, in addition to a Preference Segmentation score, a Driver Analysis identifying what's working, what's not working and relative importance of driving reasons behind acceptance or rejection for each promotion. Each respondent's verbatim comments on why they rated as they did are reported for high granularity insight. This provides rich development feedback for refining and optimizing. (See the High-Resolution Multiple Concept Test description above for more details on scoring.)
Customer Experience Benchmarking
Customer Satisfaction / Dissatisfaction Test - Brand Health
This study gives you a CAT Scan of your customer base and helps you learn where to put your resources to get the most bang for the buck. It compares recent experience with (a) expectations for your brand, (b) with closest competition and (c) with your customers' impression of the industry in general. Personal Rating Score is calculated for each customer. Customers see and agree with their own ratings. Key reasons for Personal Rating are given by each customer. This test points out specific action recommendations to reduce dissatisfaction and customer loss. It describes your specific strengths and identifies your product or service weaknesses and vulnerabilities - and to whom.
Satisfaction Segmentation Acceptance score shows how many customers are completely satisfied, how many are Borderline, how many are Indifferent and how many - and who - are Rejectors. We also calculate a Net Promoter Score as an additional diagnostic measure.
Benchmark all competitors. Uncover strengths, weakness, consumers' language for the category, identify important variables. Identify opportunities and brand vulnerabilities. Uncover marketplace or brand 'Points of Pain' and Needs Not Met, or uncover poorly met customer needs, unsolved problems. Identify problem areas and areas of opportunity compared to competition.
Profile Your Customers Directly asking what features of your product are used, and what behaviors they currently engage in, along with demographics, identifies who the high revenue customers are and their attitude and likely future behavior.
Driver Analysis shows levers driving satisfaction and specific sources of dissatisfaction. Degree of Importance/Utility of each feature or problem.
Each feature or problem's absolute and relative degree of importance in discrimination driving Acceptance or Rejection of the brand - cut by Total customers, Value of Customer or any variables desired. Percent selecting each feature or problem as a key reason for rating the brand as they did
We take additional ratings of features, problems, issues on level of importance to me in making decision to stay or go. We cut that data by Acceptors, Borderline, Rejectors. Data is generally similar to Driver Analysis.
Analyze lapsed customers, why they dropped out or slowed down their purchasing. Identify what actions you might take to regain former customers and accelerate purchasing among laggards.
Key Competitor Customer Satisfaction / Dissatisfaction Test
This study gives you a CAT Scan of your KEY COMPETITORS, putting you in the seat of their Chief Marketing Officer. This "deep slice" into your competitor will give you a S.W.O.T analysis as you gain insight into where your competitors are excelling with their customers and where there may be vulnerabilities to exploit as you develop and refine your marketing strategy. This study is done using panels to identify present and former users of your competition. It compares recent experience with expectations and with their closest competition. It describes their specific strengths and identifies their product or service weaknesses.
Satisfaction Segmentation Acceptance score shows how many of your competitor's customers are completely satisfied, how many are Borderline, how many are Indifferent and how many - and who - are Rejectors. Each test features a full Driver Analysis which helps you understand levers driving satisfaction and specific sources of dissatisfaction. Closely analyze their lapsed customers, why they dropped out or slowed down their purchasing. You also hear from from their customers and former customers in their own words why they rate your competitor as they do.
Market Review - All Competitor Reviews and Benchmarking by All Users
This broad market review maps the entire market for the product category. The All Competitor User Review and Benchmarking provides an in-depth review of each respondent's most recently used brand or product in the market category or space. See where you stand among your users compared to where all major competitors stand with their users. Each person's most recently used brand is compared with their next two likely alternatives. Benchmark all competitors. Discover strengths, weakness, consumers' language for the category, identify important variables. Identify opportunities and brand vulnerabilities.
You can also use Linescale Rating Sets to measure each respondent's rating of all brands overall, or for any specific characteristic. You can uncover Marketplace 'Points of Pain' and Needs Not Met by most popular brands or products in the market, or uncover poorly met customer needs, problems unsolved. Identify problem areas and areas of opportunity compared to competition, which can lead to creation of new features, new ideas or new products. Driver Analysis and full diagnosis for the category as a whole, and if sample size is sufficient, a complete Driver Analysis can be available for each individual major brand.
Corporate or Brand Imagery and Reputation
This study assesses the profile, strengths and weaknesses of a company, institution, brand or personality both absolutely and versus comparables in the marketplace. It probes for consumer language, issues and variables important in positioning the test entity by eliciting reasons for assessment by Acceptors, Borderline, Indifferent and Rejectors. Comparisons to comparables can be made directly using Linescale Rating Sets with metric scores and paired comparisons versus all comparables. Effective either as a one-off study or for tracking reputation and imagery longitudinally.
- Assessment of corporate entity in context of comparable entities
- Verbatim descriptions elicited by respondent explanations of reasons for their assessment
- Quantitative Driver Analysis profile
- Overall evaluation directly versus all comparables
Brand Awareness, Attitude and Satisfaction Tracking Study
This study among prospects and users either measures one-time or tracks brand awareness and performance over time. Extremely useful for evaluating and diagnosing marketing and product change impact, competitive effect over time. Why aren't more prospects turning into customers? Compare recent experience or impression with original expectations and with closest competition. Points out specific action recommendations to reduce dissatisfaction and customer loss. Shows your specific strengths and identifies your product or service or image weaknesses.
Satisfaction Segmentation Acceptance score shows how many customers and prospects are completely satisfied, how many are Borderline, how many are Indifferent and how many - and who - are Rejectors. Each test features a full Driver Analysis which helps you understand levers driving satisfaction and specific sources of dissatisfaction. It looks closely at Interested prospects and lapsed customers to identify what barriers there are to becoming or staying customers. Importantly, it can suggest what actions might overcome resistance to trial, or what actions you might take to regain former customers and accelerate purchasing among the laggards.
You also hear from your prospects, customers and former customers in their own words why they rate you as they do. You can also use this test to measure advertising awareness and source of information to complement the in-depth attitude and behavior findings.
Website Visitor Satisfaction and Tracking
Directly compare website visitor experience with expectations for the site and with closest competitive sites. Visitors select and evaluate all activities they intended or actually did. Driver Analysis and full diagnosis of current website. Overall evaluation on key attributes. Specific evaluations of functions and features. Positives and negatives of experience, Driver Analysis and diagnosis. Satisfaction Segmentation plus optional evaluation of potential additional Web site features or changes.
This is an excellent attitudinal complement to behavioral tracking. Understand why visitors lingered - were they intrigued or baffled? What's missing?
Are you unnecessarily losing potential revenue? Why aren't those who intended to buy completing the transaction? Why aren't more browsers transacting? Track and Trend visitor satisfaction, transaction flow and reasons why and why not.
Transactional Satisfaction, In-Market Product Test
Directly compare expectations for a recently purchased product versus actual experience. Satisfaction Segmentation. Driver Analysis and full diagnosis of product features, strengths, weaknesses. Opportunity to test alternative benefits and features.
Website and Kiosk Research and Development
Website Visitor Satisfaction and Tracking
In-depth evaluation. Directly compare website visitor experience benchmarked with both expectations and with competitive sites. Visitors select and evaluate all activities they intended or actually did. Driver Analysis and full diagnosis of current website. Overall evaluation on key attributes. Specific evaluations of functions and features. Positives and negatives of experience, Driver Analysis and diagnosis. Satisfaction Segmentation plus optional evaluation of potential additional Web site features or changes.
This is an excellent attitudinal complement to behavioral tracking. Understand why visitors lingered - were they intrigued or baffled? What's missing?
Are you unnecessarily losing potential revenue? Why aren't those who intended to buy completing the transaction? Why aren't more browsers transacting? Track and Trend visitor satisfaction, transaction flow and reasons why and why not.
Website and Kiosk User Experience Development Lab
Website, Kiosk or App UI and Functionality - Remote Lab For Websites, Kiosks or potential site upgrades at a developmental stage. The benefits of a UI lab done large scale at respondent's own PC or mobile device. Full site or navigation schemes, components or mini-application sections of screen flows. Compare concept of website or kiosk with proposed screen set style, clarity, usability, navigation and flow.
Here's how it works:
- Evaluation of concept, then fixed or variable sequence of screen shots or mini-app is presented, experienced and rated.
- Overall evaluation compared to concept and competitive alternatives
- Evaluation on key attributes.
- Specific evaluations of test functions and tasks.
- Driver Analysis and full diagnosis. Positives and negatives of experience.
- Acceptance segmentation plus optional evaluation of potential additionalwebsite features or changes.
Specialty Research Products
Enhanced Focus Group Screener
The Enhanced Screeners give a new dimension to focus groups. In addition to your normal screening questions, a new, Enhanced Screener that can first assess category usage, favorites, ratings of favorites, normative scoring of all existing products in the category and even reasons for levels of acceptance or rejection of each product by each individual respondent – those that ultimately may be terminated, and those who finally qualify.
The a priori information from the Enhanced Screener can be helpful to you in multiple ways:
- Qual-Quant Information on all competitors or alternatives in the category from those otherwise not qualified for the qualitative session adds quant background to the insights you will derive from the qualitative research
- Insights from the pre-interview can sharpen areas of qualitative focus, improving the moderator’s breadth of exploration as well as efficient use of time
- The Enhanced Screener information gives immediate in-depth context for each respondent, beyond demographics
- Increased reliability of information compared to telephone recruiting alone improves certainty Focus Group respondent is truly qualified before arriving at the group
- New criteria may emerge from the pre-interview which better inform your final selection of respondents
The Enhanced Screener works by embedding a two-minute, compressed Market Review into your screener. These are questions screeners normally ask but are organized and designed to create the Market Review. Importantly, this Market Review does not bias or pre-dispose respondents in any way. Questions are usage and brand neutral. The results are instantly available to you online as the screener is being conducted. At the conclusion you can print it for reference before, during and after the focus group sessions.
Interactive Focus Group Moderator's Tool
A thorough individual and group evaluation and diagnosis of a focused single concept under guidance of the moderator. Provides a live and immediate structured report by the total group and by individual respondent as the group session is being conducted. This is useful for both the moderator and the observing client. The printable online report also provides a format for the moderator to add written summary, insights and recommendations.
Linescale General Surveys
A General Survey lets you write your own survey or test. While a general survey cannot generate Linescore Preference Segmentation, you can custom design and write an ad hoc test or ask simple survey questions using all the Linescale tools. Full cross-tab and banner report online and exportable as full data set or by tables. Create your own analysis. Useful for quick question and answer surveys.